
Network downtime is no longer just an inconvenience; it’s a line item that can sink a small business. IT downtime now costs enterprises an average of $14,056 per minute, and one in five major outages tops $1 million in total losses, according to Uptime Institute and ITIC data. It gets worse before it gets better: global network outages rose 33.38% between January and May 2025 alone, and Cloudflare tracked 174 major internet outages worldwide that same year.
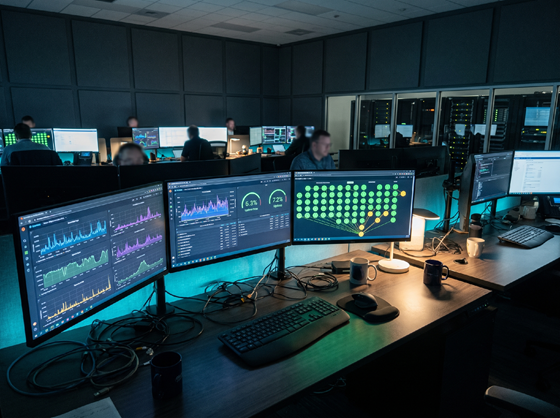
If you run a small business or manage IT for a growing team, especially somewhere with unreliable power or inconsistent ISP service, you feel these numbers more acutely than a Fortune 500 company does. A single hour of downtime can mean missed orders, frustrated customers, or a support inbox that won’t stop filling up. Network monitoring tools exist to catch problems before your users do. They watch your servers, routers, bandwidth, and applications around the clock, and they alert you the moment something looks wrong.
This list covers eight tools worth your attention in 2026, ranked with smaller teams and real-world budgets in mind, not just enterprise IT departments with unlimited headcount.
What to Look For in a Network Monitoring Tool

Not every tool fits every team. Before you pick one, weigh these factors:
- Real-time visibility – how fast does the tool detect and report an issue?
- Ease of setup – can you get it running in an afternoon, or does it need a dedicated engineer?
- Pricing and free tier – does it scale with you, or does it punish growth with steep usage fees?
- Scalability – will it still work when you go from 10 servers to 200?
- Alerting – does it notify you through channels you actually check?
- Integration – does it play nicely with the stack you already run?
These criteria matter more than they sound. Gartner’s 2025 Infrastructure & Operations research found that 76% of outages involve failures that were detectable before they became user-impacting. In plain terms: most outages aren’t surprises. They’re warnings nobody caught in time, because the monitoring wasn’t good enough or wasn’t there at all.
1. Netdata
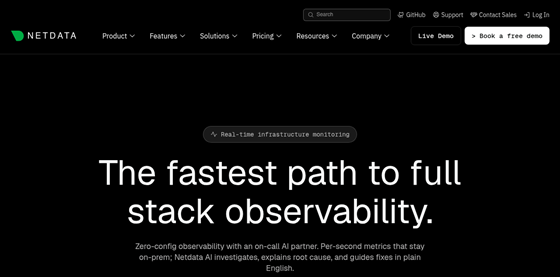
Netdata tracks metrics per second rather than every few minutes, which is the difference between catching a spike as it happens and reading about it after your site already went down. It runs light enough to install on a Raspberry Pi without choking it, and the free tier covers up to 5 nodes with full historical metrics, no credit card required.
What sets it apart for smaller teams is the setup time. You install an agent, and within seconds you get thousands of pre-configured metrics with zero manual dashboard building. Its machine-learning anomaly detection flags unusual behavior automatically, so you’re not stuck writing alert thresholds by hand. On G2, Netdata holds a 4.6 out of 5 rating from 54 reviews, edging out Datadog’s 4.4 out of 5 from 708 reviews, a solid signal for a tool that’s open-source at its core.
For businesses that want one of the best network monitoring tools without a five-figure annual contract, Netdata is the natural starting point.
2. Datadog
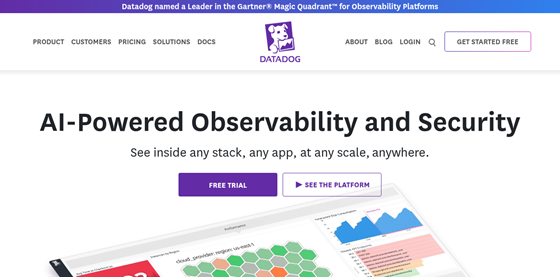
Datadog is a cloud-native, full-stack observability platform that covers infrastructure, application performance, logs, and network traffic in one place. It’s a strong pick if you’re running a hybrid environment with a mix of cloud providers and on-prem servers, since it unifies everything into a single pane of glass.
The catch is cost. Datadog’s usage-based pricing scales with every host, container, and custom metric you add, and it’s one of the most frequently cited “our bill exploded” complaints among practitioners on forums and review sites. It’s powerful, but budget-conscious teams tend to outgrow their comfort zone fast once usage climbs.
3. Zabbix

Zabbix is free, open-source, and genuinely enterprise-grade despite the zero price tag. It monitors servers, networks, applications, and databases using a mix of agents and SNMP polling, and there’s no artificial cap on the number of devices you can track.
It suits teams running a lot of on-premises infrastructure who don’t want a subscription eating into margins every month. The trade-off is that Zabbix’s interface feels dated next to newer SaaS tools, and getting the most out of it takes some patience with configuration.
4. PRTG by Paessler
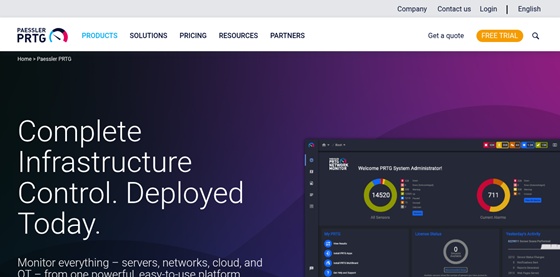
PRTG is built for Windows-centric small and mid-sized businesses that want monitoring without touching the command line much. Auto-discovery scans your network and builds a device map for you, and the free tier includes 100 sensors, enough for a lot of small offices to run without paying a cent.
It doesn’t require a cloud dependency either; everything can run on a local server if that’s your preference. Reporting is one of its stronger features, with clean, exportable summaries that help you justify an infrastructure upgrade to a non-technical manager.
5. Nagios
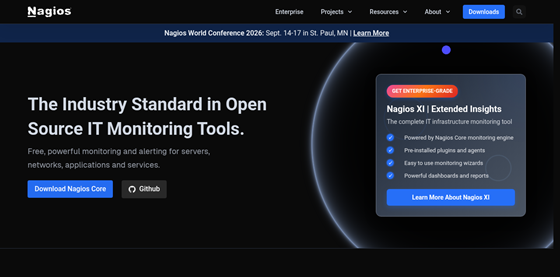
Nagios has been around for decades, and its core remains free and endlessly customizable through community plugins. If your team wants full control over exactly what gets monitored and how, Nagios gives you that, but it comes with a steep learning curve that will test a team without dedicated systems engineers.
Continuous, proactive monitoring isn’t just a convenience; it’s increasingly treated as a baseline security practice. CISA’s guidance on securing networks emphasizes that ongoing visibility into network activity is essential for catching threats before they escalate, not just for spotting slow servers.
6. ManageEngine OpManager
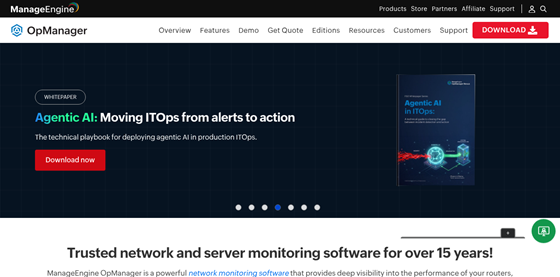
OpManager is an all-in-one network and server monitoring suite that leans heavily into Windows and Active Directory environments. Mid-size IT teams tend to like it because it consolidates device monitoring, fault management, and performance dashboards into a single interface instead of juggling separate tools.
It’s a natural companion for organizations that already lean on managed cloud hosting providers for part of their infrastructure, since OpManager can track both the on-prem and hosted sides from one dashboard.
7. Site24x7
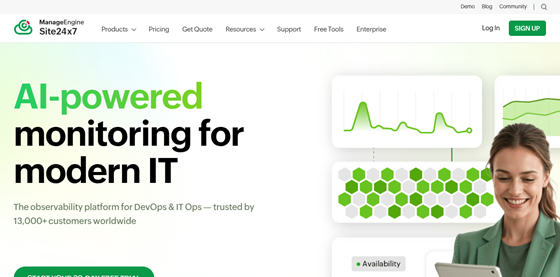
Site24x7 is a cloud-based monitoring service that covers websites, servers, applications, and network devices from a single SaaS dashboard. Entry-level pricing is friendlier than most enterprise competitors, which makes it a reasonable option for teams that want breadth without committing to a big contract upfront.
It’s particularly handy for distributed teams managing infrastructure remotely, similar to how businesses rely on cross-platform remote access software to support servers and employees across different locations and operating systems.
8. Auvik
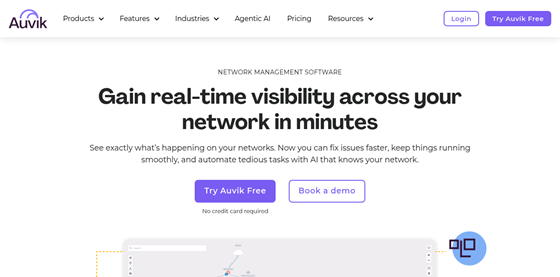
Auvik is built specifically for managed service providers juggling multiple client networks at once. Its standout feature is automated network mapping, which builds a live topology diagram without manual entry, alongside automatic configuration backups that save MSPs from painful recovery scenarios after a device fails.
The push toward this kind of continuous, automated oversight isn’t unique to MSPs. Even federal agencies have struggled here: a 2025 GAO network monitoring report found that programs at several agencies needed further guidance and stronger implementation to close visibility gaps, underscoring just how easy continuous monitoring is to get wrong without the right tooling.
Final Thoughts
If you want real-time, low-overhead visibility with a free tier that doesn’t expire in 14 days, Netdata leads this list for a reason. It gets you meaningful data fast, without demanding a dedicated ops engineer just to read a dashboard.
Whichever tool you choose, the payoff for picking well shows up in your recovery numbers. A 2026 downtime-cost analysis by JustAnalytics found that industry-wide Mean Time to Recovery has dropped from 78 minutes in 2020 to 53 minutes in 2025, largely credited to better monitoring and automation adoption. That’s not a small improvement; it’s the difference between a five-minute blip nobody notices and a lunch-hour outage your customers won’t forget.
Pair your monitoring setup with a solid backup strategy too. Many of the businesses that recover fastest from an outage already have one of the best cloud data storage services running alongside their monitoring stack, so downtime doesn’t turn into data loss on top of it.